Profiling
One of Lambda’s biggest strengths, its ability to automatically scale across ephemeral containers in response to increased load, also creates one of its biggest problems: observability. The traditional set of tools used to identify performance bottlenecks are no longer valid, as there is no host into which one can SSH and interactively interrogate. Identifying performance bottlenecks is even more significant due to the Lambda pricing model, where idle time often directly translates into increased costs.
However, Go offers the excellent pprof tool to visualize and cost allocate program execution. Beginning with Sparta 0.20.4, it’s possible to enable per-lambda instance snapshotting which can be locally visualized. This documentation provides an overview of how to enable profiling. The full source is available at the SpartaPProf repo.
To learn more about pprof itself, please visit:
- @rakyll’s blog
- Profiling Go programs with pprof
- Profiling Golang
- Profiling and optimizing Go web programs
Enabling Profiling
To enable profiling add a reference to ScheduleProfileLoop
in your main() function as in:
sparta.ScheduleProfileLoop(nil,
  5*time.Second,
  30*time.Second,
  "goroutine",
  "heap",
  "threadcreate",
  "block",
  "mutex")
This function accepts the following arguments:
s3Bucket: The S3 bucket to which profile snapshots should be written. Ifnil, the bucket used to host the original ZIP code archive is used.snapshotInterval- The interval between each snapshot.cpuProfileDuration- The duration for the CPUProfile sample.profileNames...- The profile types to snapshot. In addition to the standard profiles, Sparta includes a “cpu” profile iff thecpuProfileDurationis non-zero.
Profiling Implementation
During the provision step, the ScheduleProfileLoop adds an IAMRolePrivilege Allow entry (if possible) to each Lambda function’s IAM policy. This policy extension is a minimal privilege and only enables s3:PutObject against the Sparta managed key prefix (see below).
The provision implementation also annotates the Lambda’s Environment map so that the publishing loop knows where to publish snapshots.
During the execute step when the Sparta binary is executing in AWS Lambda, the ScheduleProfileLoop installs the requested sampling and publishing steps so that profile snapshots, serialized as proto files, are properly saved to S3. Profiles are published to a reserved location in S3 with the form:
s3:://{BUCKET_NAME}/sparta/pprof/{STACK_NAME}/profiles/{PROFILE_TYPE}/{SNAPSHOT_INDEX}-{PROFILE_TYPE}.λ-{INSTANCE_ID}.profile
To manage profile sprawl, each lambda instance uses a rolling SNAPSHOT_INDEX to maintain a fixed size window. The new profile command is responsible for aggregating them into a single local, consolidated profile that can be visualized using the existing tools.
Deploying
With profiling enabled, the next step is to deploy the SpartaPProf service using the provision command:
$ go run main.go provision --s3Bucket MY-S3-BUCKET
INFO[0000] ════════════════════════════════════════════════
INFO[0000] ╔═╗╔═╗╔═╗╦═╗╔╦╗╔═╗   Version : 1.4.0
INFO[0000] ╚═╗╠═╝╠═╣╠╦╝ ║ ╠═╣   SHA     : 8f199e1
INFO[0000] ╚═╝╩  ╩ ╩╩╚═ ╩ ╩ ╩   Go      : go1.11.1
INFO[0000] ════════════════════════════════════════════════
INFO[0000] Service: SpartaPProf-mweagle                  LinkFlags= Option=provision UTC="2018-10-11T14:59:48Z"
INFO[0000] ════════════════════════════════════════════════
INFO[0000] Using `git` SHA for StampedBuildID            Command="git rev-parse HEAD" SHA=c3fbe8c289c3184efec842dca56b9bf541f39d21
INFO[0000] Provisioning service                          BuildID=c3fbe8c289c3184efec842dca56b9bf541f39d21 CodePipelineTrigger= InPlaceUpdates=false NOOP=false Tags=
INFO[0000] Verifying IAM Lambda execution roles
INFO[0000] IAM roles verified                            Count=2
INFO[0000] Checking S3 versioning                        Bucket=MY-S3-BUCKET VersioningEnabled=true
INFO[0000] Checking S3 region                            Bucket=MY-S3-BUCKET Region=us-west-2
INFO[0000] Running `go generate`
INFO[0000] Compiling binary                              Name=Sparta.lambda.amd64
INFO[0002] Creating code ZIP archive for upload          TempName=./.sparta/SpartaPProf_mweagle-code.zip
INFO[0002] Lambda code archive size                      Size="17 MB"
INFO[0002] Uploading local file to S3                    Bucket=MY-S3-BUCKET Key=SpartaPProf-mweagle/SpartaPProf_mweagle-code.zip Path=./.sparta/SpartaPProf_mweagle-code.zip Size="17 MB"
INFO[0009] Calling WorkflowHook                          ServiceDecoratorHook= WorkflowHookContext="map[]"
INFO[0009] Uploading local file to S3                    Bucket=MY-S3-BUCKET Key=SpartaPProf-mweagle/SpartaPProf_mweagle-cftemplate.json Path=./.sparta/SpartaPProf_mweagle-cftemplate.json Size="7.1 kB"
INFO[0010] Issued CreateChangeSet request                StackName=SpartaPProf-mweagle
INFO[0013] Issued ExecuteChangeSet request               StackName=SpartaPProf-mweagle
INFO[0026] CloudFormation Metrics ▬▬▬▬▬▬▬▬▬▬▬▬▬▬▬▬▬▬▬▬▬▬▬▬▬
INFO[0026]     Operation duration                        Duration=11.71s Resource=SpartaPProf-mweagle Type="AWS::CloudFormation::Stack"
INFO[0026]     Operation duration                        Duration=1.60s Resource=HelloWorldLambda7d01d27fe422d278bcc652b4a989528718eb88af Type="AWS::Lambda::Function"
INFO[0026]     Operation duration                        Duration=1.33s Resource=KinesisLogConsumerLambda275ace0435c45228161570811178ce06fbcb359c Type="AWS::Lambda::Function"
INFO[0026] Stack Outputs ▬▬▬▬▬▬▬▬▬▬▬▬▬▬▬▬▬▬▬▬▬▬▬▬▬▬▬▬▬▬▬▬▬▬
INFO[0026]     HelloWorldFunctionARN                     Description="Hello World Lambda ARN" Value="arn:aws:lambda:us-west-2:123412341234:function:SpartaPProf-mweagle_Hello_World"
INFO[0026]     KinesisLogConsumerFunctionARN             Description="KinesisLogConsumer Lambda ARN" Value="arn:aws:lambda:us-west-2:123412341234:function:SpartaPProf-mweagle_KinesisLogConsumer"
INFO[0026] Stack provisioned                             CreationTime="2018-10-03 23:34:21.142 +0000 UTC" StackId="arn:aws:cloudformation:us-west-2:123412341234:stack/SpartaPProf-mweagle/da781540-c764-11e8-9bf1-0aceeffcea3c" StackName=SpartaPProf-mweagle
INFO[0026] ════════════════════════════════════════════════
INFO[0026] SpartaPProf-mweagle Summary
INFO[0026] ════════════════════════════════════════════════
INFO[0026] Verifying IAM roles                           Duration (s)=0
INFO[0026] Verifying AWS preconditions                   Duration (s)=1
INFO[0026] Creating code bundle                          Duration (s)=2
INFO[0026] Uploading code                                Duration (s)=8
INFO[0026] Ensuring CloudFormation stack                 Duration (s)=17
INFO[0026] Total elapsed time                            Duration (s)=27
Generating Load
While the SpartaPProf binary does include functions that are likely to generate profiling data, we still need to issue a sufficient series of events to produce a non-empty profile data set. SpartaPProf includes a simple tool (cmd/load.go) that directly calls the provisioned lambda function on a regular interval. It accepts a single command line argument, the ARN of the lambda function listed as a Stack output in the log output:
INFO[0058] FunctionARN Description="Lambda function ARN" Value="arn:aws:lambda:us-west-2:123412341234:function:SpartaPProf_mweagle_Hello_World"Run the simple load generation script with the ARN value as in:
$ cd cmd
$ go run load.go arn:aws:lambda:us-west-2:012345678910:function:SpartaPProf-mweagle-Hello_World
Lambda response (0 of 60): "Hi there 🌍"
Lambda response (1 of 60): "Hi there 🌍"
Lambda response (2 of 60): "Hi there 🌍"
Lambda response (3 of 60): "Hi there 🌍"
Lambda response (4 of 60): "Hi there 🌍"
Lambda response (5 of 60): "Hi there 🌍"
Lambda response (6 of 60): "Hi there 🌍"
Lambda response (7 of 60): "Hi there 🌍"
Lambda response (8 of 60): "Hi there 🌍"
Lambda response (9 of 60): "Hi there 🌍"
Lambda response (10 of 60): "Hi there 🌍"
Lambda response (11 of 60): "Hi there 🌍"
...
After all the requests have completed for this sample against a stack provisioned in us-west-2, a set of named profiles was published. Since each container’s instance id is randomly assigned, the profile names you see will have slightly different names
---------------------------------------------------------------
S3 bucket: s3://weagle/sparta/pprof/SpartaPProf-mweagle/profiles
---------------------------------------------------------------
2017-11-26 11:32:28   41 Bytes sparta/pprof/SpartaPProf-mweagle/profiles/block/0-block.λ-3838737145763622974.profile
2017-11-26 11:32:27    1.8 KiB sparta/pprof/SpartaPProf-mweagle/profiles/cpu/0-cpu.λ-3838737145763622974.profile
2017-11-26 11:32:28    1.8 KiB sparta/pprof/SpartaPProf-mweagle/profiles/goroutine/0-goroutine.λ-3838737145763622974.profile
2017-11-26 11:32:28    2.2 KiB sparta/pprof/SpartaPProf-mweagle/profiles/heap/0-heap.λ-3838737145763622974.profile
2017-11-26 11:32:28   54 Bytes sparta/pprof/SpartaPProf-mweagle/profiles/mutex/0-mutex.λ-3838737145763622974.profile
2017-11-26 11:32:30  200 Bytes sparta/pprof/SpartaPProf-mweagle/profiles/threadcreate/0-threadcreate.λ-3838737145763622974.profile
Visualizing Profiles
Sparta delegates to the pprof webui to visualize profile snapshots. Ensure you have the latest version of this by running go get -u -v go get github.com/google/pprof first.
The final step is to provide the profile snapshots to pprof. Sparta exposes a profile command that accomplishes this, by fetching and consolidating all published profiles for a single type.
$ go run main.go profile --s3Bucket weagle
INFO[0000] ════════════════════════════════════════════════
INFO[0000] ╔═╗┌─┐┌─┐┬─┐┌┬┐┌─┐   Version : 1.0.2
INFO[0000] ╚═╗├─┘├─┤├┬┘ │ ├─┤   SHA     : b37b93e
INFO[0000] ╚═╝┴  ┴ ┴┴└─ ┴ ┴ ┴   Go      : go1.9.2
INFO[0000] ════════════════════════════════════════════════
INFO[0000] Service: SpartaPProf-mweagle                  LinkFlags= Option=profile UTC="2018-01-29T15:23:18Z"
INFO[0000] ════════════════════════════════════════════════
? Which stack would you like to profile: SpartaPProf-mweagle
? What type of profile would you like to view? heap
? What profile snapshot(s) would you like to view? Download new snapshots from S3
? Please select a heap profile type: alloc_space
INFO[0028] Refreshing cached profiles                    CacheRoot=.sparta/profiles/SpartaPProf-mweagle/heap ProfileRootKey=sparta/pprof/SpartaPProf-mweagle/profiles/heap S3Bucket=MY-S3-BUCKET StackName=SpartaPProf-mweagle Type=heap
INFO[0028] Aggregating profile                           Input=".sparta/profiles/SpartaPProf-mweagle/heap/0-heap.λ-8850662459689822644.profile"
INFO[0028] Consolidating profiles                        ProfileCount=1
INFO[0028] Creating consolidated profile                 ConsolidatedProfile=.sparta/heap.consolidated.profile
INFO[0028] Starting pprof webserver on http://localhost:8080. Enter Ctrl+C to exit.
The profile command downloads the published profiles and consolidates them into a single cached version in the ./sparta directory with a name of the form:
./.sparta/{PROFILE_TYPE}.consolidated.profile
You can choose to use the cached file if it exists.
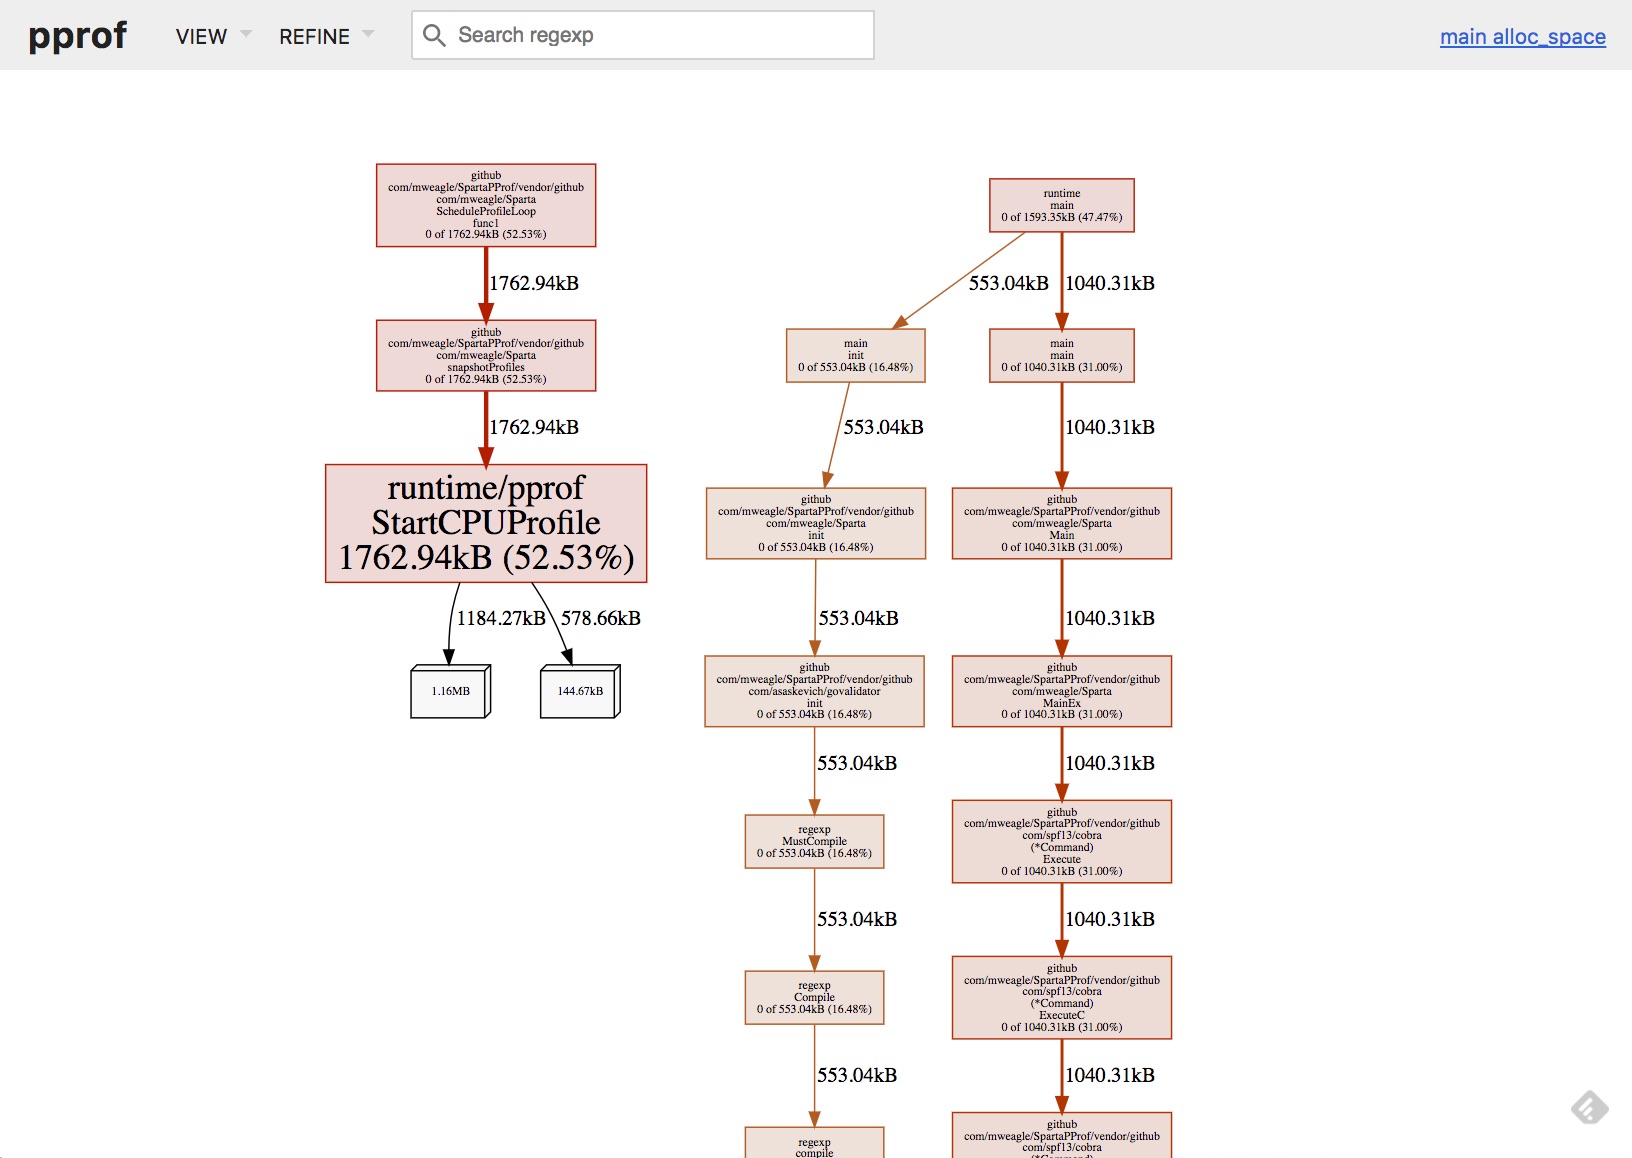
For this sample run, the heap profile output is made available to the pprof webserver which produces the following layout:
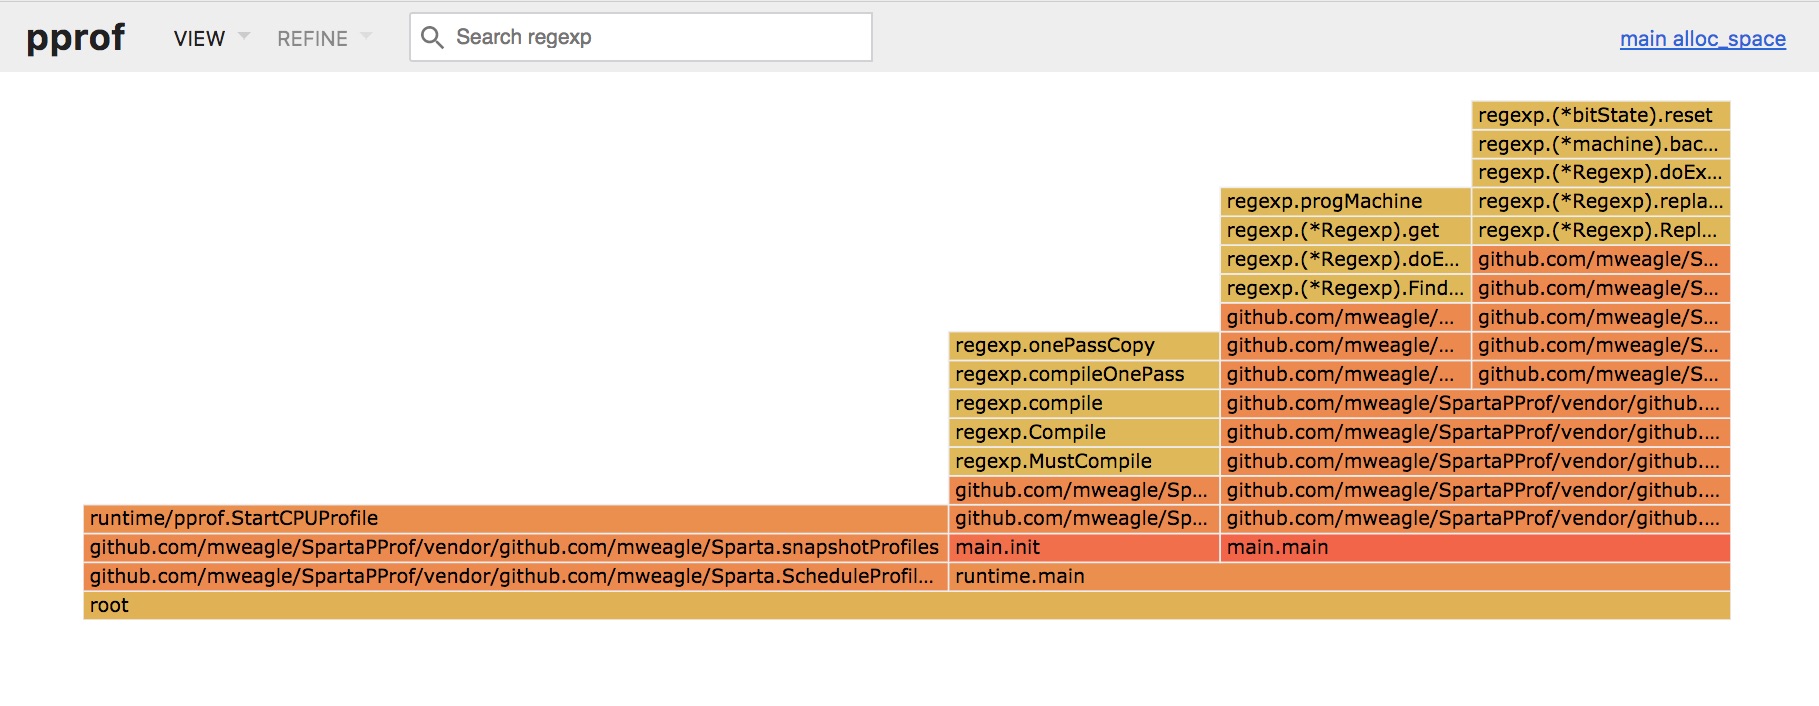
The latest pprof also includes flamegraph support to help identify issues:
To view another profile type, enter Ctrl+C to exit the blocking web ui loop and launch another profile session.
Conclusion
Go includes a very powerful set of tools that can help diagnose performance bottlenecks. With the Sparta profile command, it’s possible to bring that same visibility to bear to AWS Lambda, despite running on ephemeral, (typically) unaddressable hosts. Get started optimizing today! And also, don’t forget to disable the profiling loop before pushing to production.
Notes
- CPU Flame Graphs provides a great overview.
- It’s not currently possible to use custom profiles
- Lambda instances are limited to a window size of 3 rolling snapshots
- The
explorecommand also exposes thepprofweb handlers for local exploration as well.